
Sunset over Upper Geyser Basin near Old Faithful, Yellowstone National Park. Photo courtesy of Scott Bischke.
Key Messages
-
Under RCP4.5, all four seasons warm relative to the 1986-2005 base period. GYA mean annual temperature is projected to increase 5°F (3°C) by the period 2061-2080 and stabilize thereafter in response to the expected mitigation of greenhouse gas emissions. [high confidence; 100% model agreement and SNR >1]
-
Under RCP8.5, all four seasons warm relative to the 1986-2005 base period and the GYA mean annual temperature is projected to increase more than 10°F (5.6°C) by the end of the 21st century. [high confidence, 100% model agreement and SNR >1]
-
By the end of the century, the number of hot days per year (high temperature above 90°F [32°C]) is projected to increase and exceed a week in Pinedale WY and a month in Cody WY under RCP4.5. Under RCP8.5, the number of hot days per year increases to nearly two months in Jackson WY and Pinedale WY and exceeds two months in Bozeman MT and Cody WY. [high confidence, statistical significance of the trends]
-
By the end of the century, the number of cold days (low temperature below 32°F [0°C]) experienced by towns in the major watersheds is projected to decrease by about a month and a half under RCP4.5 and up to two and a half months under RCP8.5. [high confidence, statistical significance of trends]
Details of Temperature Projections
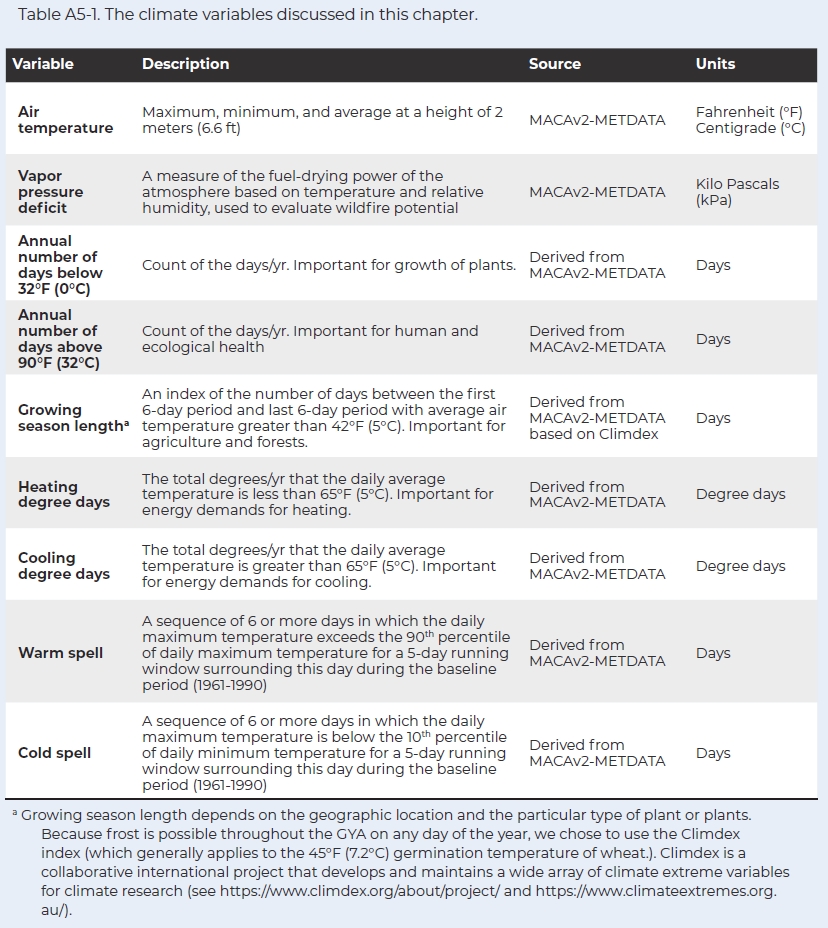
We provide the details of the projections through time and space with interrelated maps, graphs, and “checkerboard” plots. We focus on RCP4.5, which is representative of effective mitigation of greenhouse gases by the mid century projections and include projections for RCP8.5 to cover the full range of possible outcomes.[1] The related RCP8.5 graphics, designated by an “A” (e.g., Figure A5-2) are included in the appendix to this chapter, as is Table A5-1, which details the climate variables discussed in this chapter.
Seasonal Temperature Changes Over the GYA
The seasonal climatology of air temperature over the GYA reflects the prevailing climate source region (e.g., Pacific versus Arctic during winter) and the contrast between high and low elevations (Figure 5-1 and Figure A5-1 in the appendix to this chapter). In the base period (1986-2005), as in the past, the coldest winter temperatures occur across the Yellowstone Plateau, the Absaroka and Wind River ranges, and around Pinedale WY. The warmest summer temperatures occur in the Gallatin and Yellowstone River valleys, the Upper Snake HUC6 watershed, and valleys of the Missouri Headwaters. The temperature contrast between high and low elevations is maintained in the four future periods in RCP4.5 and is more evident under RCP8.5.
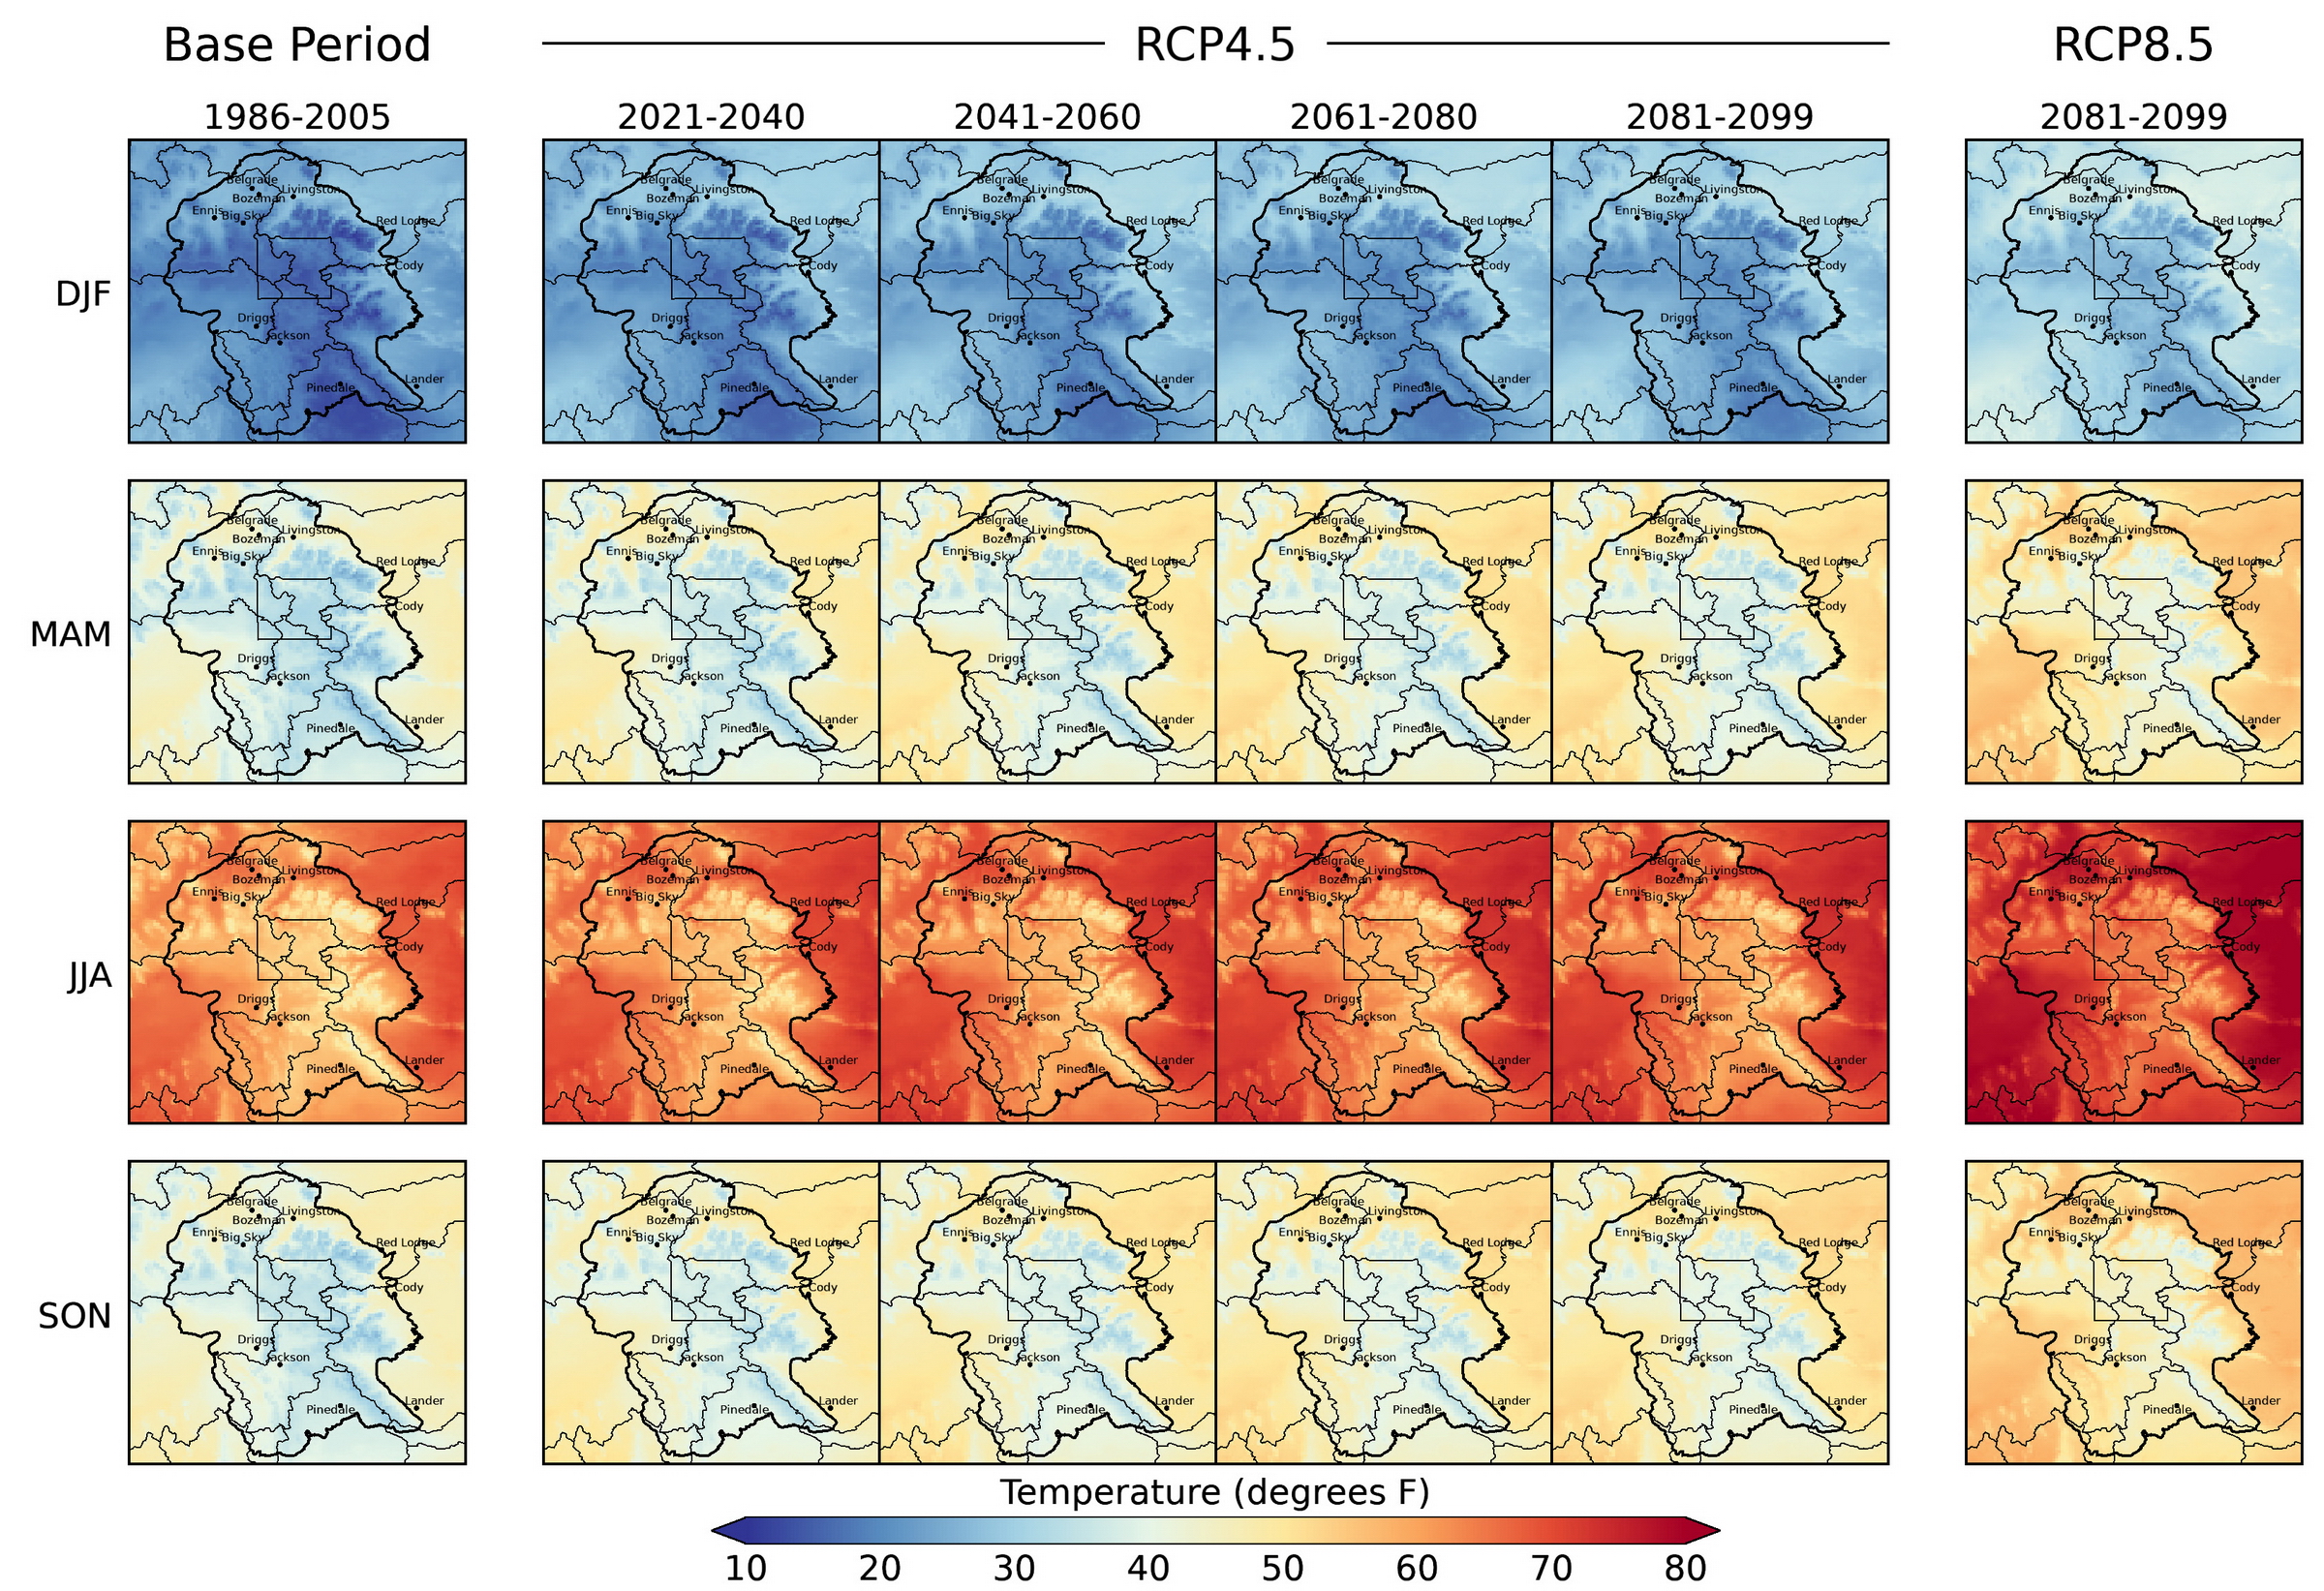
Figure 5-1. Seasonal mean temperature (average of minimum and maximum temperatures) in the Greater Yellowstone Area for the 1986-2005 base period (left column), Representative Concentration Pathway 4.5 (RCP4.5, four center columns), and the end of the 21st century under RCP8.5 (right column). The seasons (e.g., December-February [DJF]) are arranged in rows and the future periods (e.g., 2021-2040) are in columns. The data shown are the 20-model means of the MACAv2-METDATA. See Figure A5-1 in the appendix to this chapter for RCP8.5 maps.
Future changes in seasonal temperature are further illustrated by maps of temperature differences (or anomalies) relative to the 1986-2005 base period (Figures 5-2 and A5-2). (Note that the spatially uniform patterns of the anomalies reflect the resolution of the climate models and the downscaling method.) Temperatures increase in all seasons across the GYA in both RCP4.5 and RCP8.5, with progressively greater increases through the century, especially under the RCP8.5 scenario in which little effort to curb GHG emissions is assumed. In the near term, under RCP4.5:
-
all four seasons display temperature increases of 2-3°F (1.1-1.7°C) during the 2021-2040 period;
-
warming of 3-4°F (1.7-2.2°C) occurs during the 2041-2060 period in response to increasing greenhouse gas emissions; and
-
a maximum of 5-6°F (2.8-3.3°C) is reached during the 2061-2080 period and is maintained until the end of century in response to the mitigation of GHG emissions.

Figure 5-2. Change in seasonal mean temperature (average of minimum and maximum temperatures) in the Greater Yellowstone Area under Representative Concentration Pathway 4.5 (RCP4.5, left four columns) and at the end of the 21st century under RCP8.5 (right column). The seasons (e.g., December-February [DJF]) are arranged in rows and the changes relative to the 1986-2005 base period for each future period (e.g., 2021-2040) are in columns. The data shown are the 20-model means of the MACAv2-METDATA. See Figure A5-2 for the RCP8.5 maps.
Temperatures increase in all seasons across the GYA in both the RCP4.5 and RCP8.5 scenarios, with progressively greater increases through the century, especially under the RCP8.5 scenario in which little effort to curb GHGs is assumed.
In contrast, under RCP8.5 mid-century (2041-2060) temperatures increase by over 5°F (2.8°C) and reach increases of over 10°F (5.6°C) by the end of the 21st century, with greater changes between the 20-year periods than those of RCP4.5, particularly from 2061-2080 onward, a response to little or no mitigation of GHG emissions (Figures A5-1 and A5-2).
Under both RCP4.5 and RCP8.5, warm spells in the GYA increase through the 21st century (Figure 5-3). Under RCP8.5, by the end of the century the warm spell duration index is greater than 200 days out of the year, meaning there are more than 200 consecutive days where the daily maximum temperature exceeds the historical 90th percentile. The steady increase in warm spell duration index under both RCP scenarios represents a fundamental warming of the daily maximum temperature, as opposed to heatwaves, which are extremes relative to the prevailing climatology.

Figure 5-3. Projected duration of warm spells A) and B) and cold spells duration C) and D) in the Greater Yellowstone Area under Representative Concentration Pathway 4.5 (RCP4.5) and RCP8.5. The heavy lines are the 20-model median and the shaded bands indicate the 10th (bottom) to 90th (top) percentiles around the medians. The black portion is the 1950-2005 period and the colored portion is for the RCP simulations (2006-2099). Indexes calculated from the MACAv2-METDATA temperature data. Table A5-1 in the Appendix for details of how wet and dry spells are calculated.
In contrast, in both scenarios, the cold spell duration index, which ranges from 2-8 days over the historical period, is projected to decline to zero after about 2050. This indicates the GYA daily minimum temperature will have warmed to a point that cold days are no longer colder than the historical 10th percentile.
Annual Temperature Trends in the Watersheds
Graphs of mean annual temperature from 1950-2099 for the HUC6 watersheds illustrate the spatial differences in warming under RCP4.5 and RCP8.5 from the mid-20th through the 21st centuries (Figure 5-4).

Figure 5-4. Time-series plots of 1950-2099 mean annual temperatures (average of maximum and minimum temperatures) for the Hydrologic Unit Code 6 (HUC6) watersheds. The solid lines are the medians of the 20 models in the MACAv2-METDATA 1950-2005 (black line), and 2006-2099 under Representative Concentration Pathway 4.5 (RCP4.5, blue line) and RCP8.5 (red line). The shaded bands around the lines are the 10th (lower) and 90th (upper) percentiles of the models The inset numbers are the trends (in oF/decade) for RCP4.5 (blue) and RCP8.5 (red). An asterisk indicates a trend that is statistically significant at a 95% confidence level.
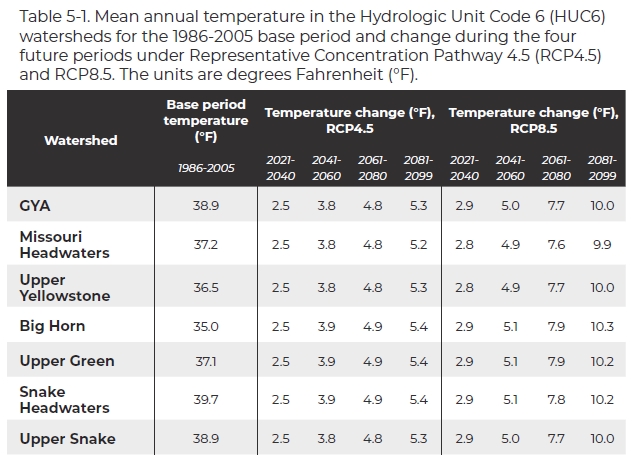
From 1950-2005 mean annual temperatures of the HUC6 watersheds differ by a range of 5°F (2.8°C); low elevations of the Upper Green watershed are the coldest (34°F [1.1°C]) and the Upper Snake watershed the warmest (39°F [3.9°C]) (Table 5-1). The warming trends evident over the period continue in both RCPs through about 2030. Thereafter, warming in RCP4.5 continues, but at a lower rate as the rate of GHG emissions drops and begins to stabilize (Figure 4-1, Table 5-1), ultimately resulting in late century warming of about 5°F (2.8°C) over all HUC6 watersheds. Under RCP8.5, the warming trends after 2030 continue at a higher rate than under RCP4.5 and ultimately result in increases over of 10°F (5.6°C) and greater by 2099.
Under RCP8.5, the warming trends after 2030 continue at a higher rate than RCP4.5 and ultimately result in increases [in mean annual temperatures] over of 10°F (5.6°C) and greater by 2099.
The Seasonal Cycle of Temperature
The progression of projected changes in monthly temperature for the base and four future periods is shown in the graphs in Figure 5-5. As suggested by the maps in Figure 5-1, the changes are essentially uniform across the HUC6 watersheds and are greater under RCP8.5 than under RCP4.5.
The narrowness of shaded bands of model spread indicates a high degree of agreement among models (which is further illustrated in Figure A5-3). Under both RCPs, just as today January remains the coldest month and July the warmest month in the future. The seasonal cycle and month-to-month changes are preserved, but each month becomes progressively warmer.

Figure 5-5. The seasonal cycle of mean monthly temperature for the Hydrologic Unit Code 6 (HUC6) watersheds under Representative Concentration Pathway 4.5 (RCP4.5) and RCP8.5. The black line shows the 1986-2005 base period. The colored lines are the 20-model means of the MACAv2-METDATA data for the periods indicated in the legend at the bottom. The shaded bands are the model spread around the respective colored mean lines.
Checkerboard plots for the HUC6 watersheds and the GYA (Figure 5-6) highlight the nature of the projected 21st-century temperature changes by presenting minimum (low) and maximum (high) air temperature separately. Each rectangular grid in Figure 5-6 illustrates the differences (anomalies) between a given period and the base period (e.g., 2021-2040 minus 1986-2005) broken down by monthly and annual means for the GYA and each HUC6 watershed.
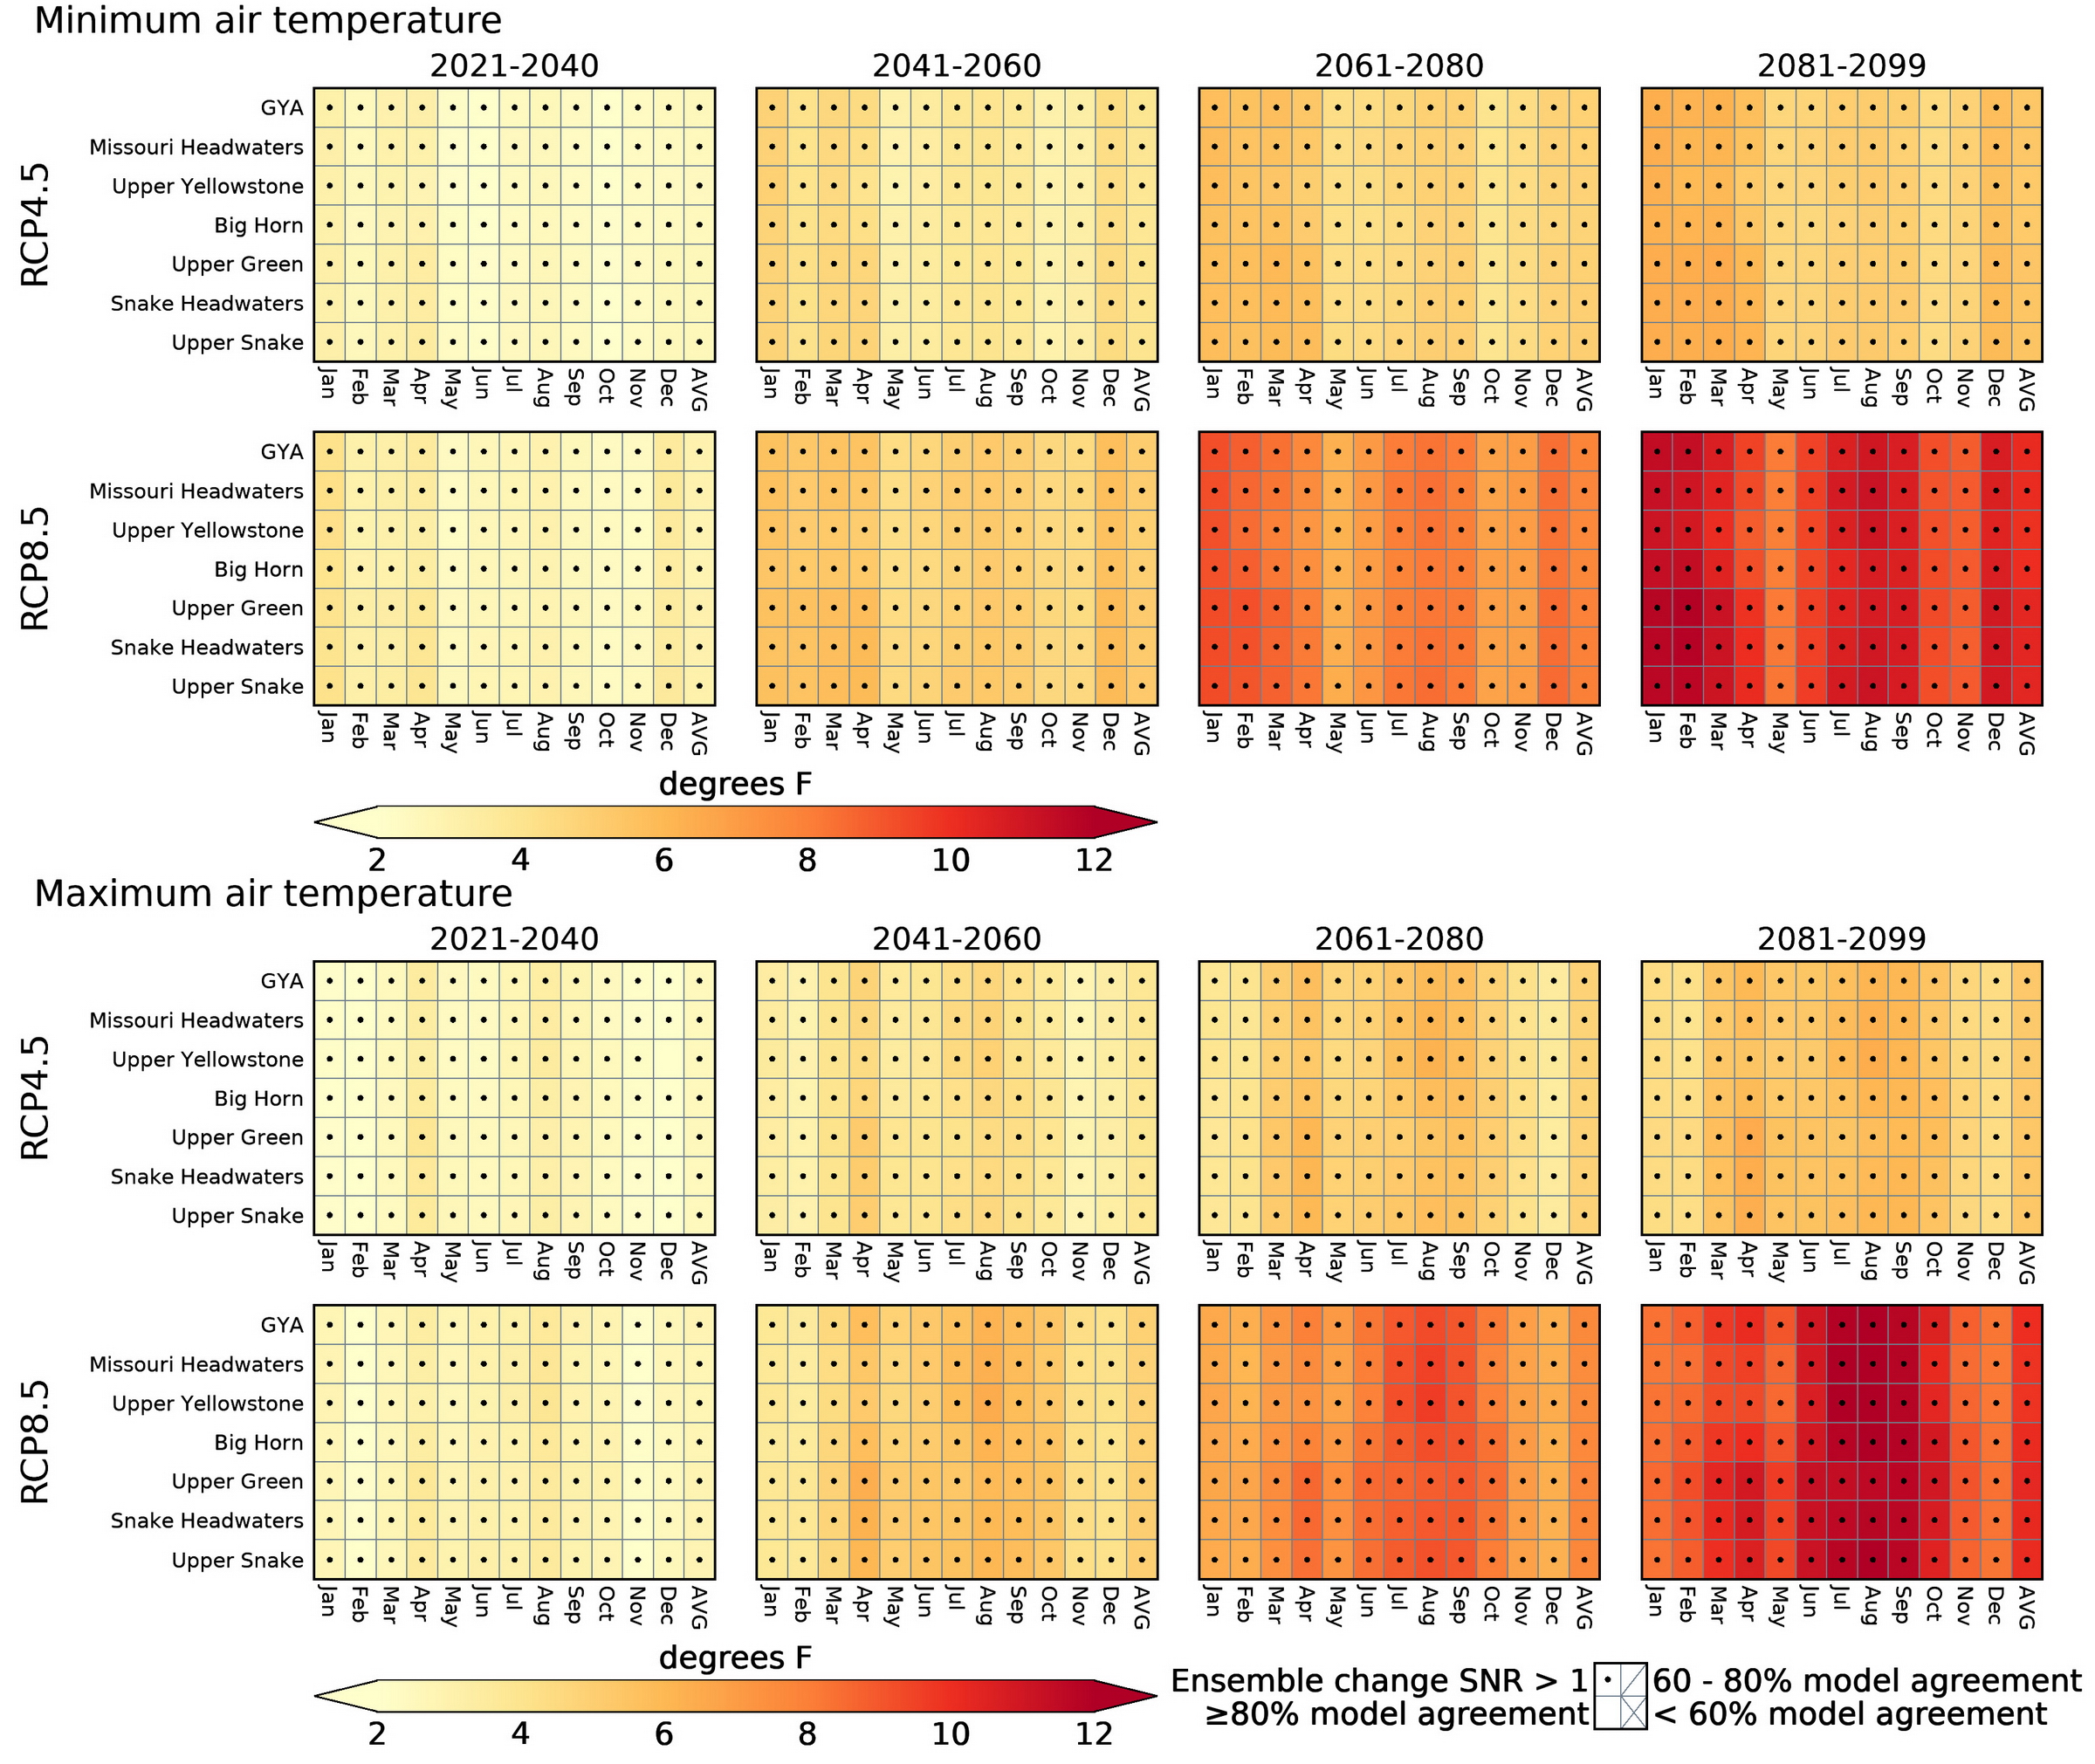
Figure 5-6. Change in projected mean monthly and annual minimum air temperature (top two rows) and average maximum air temperature (bottom two rows) in the Greater Yellowstone Area (GYA) and Hydrologic Unit Code 6 (HUC6) watersheds. The columns from left to right show changes for each future period (e.g., 2021-2040) relative to the 1986-2005 base period with Representative Concentration Pathway 4.5 (RCP4.5) on the top row and RCP8.5 on the bottom row. In each RCP figure, the months and annual mean (AVG) run from left to right across the horizontal axis on the bottom and the HUC6 watersheds and GYA run along the vertical axis on the left. Colored cells indicate >80% (more than 16 of the 20 models) agree on the sign of the change in the median value (positive or negative). A slash in a colored cell indicates that 60-80% of the models (12-16 out of 20) agree on the sign of the change, and an X in a box indicates that fewer than 60% (<12) of the models agree on the sign of the change. A black dot in a box indicates that the ensemble mean value of the future change is greater than the inter-model standard deviation (SNR >1), an indicator of significance of the change (see Chapter 1 for details). The data shown are the 20-model mean of the MACAv2-METDATA.
Relative to the 1986-2005 base period, as a group both RCPs display unidirectional warming of minimum and maximum temperatures during the four time periods; these differences from the base period display greater than 80% model agreement and, with the exception of one month in the Upper Yellowstone watershed, SNRs >1. (After 2021-2040, there is nearly 100% model agreement.) The effect of GHG stabilization under RCP4.5 versus unchecked emissions in RCP8.5 is clear, as are the patterns of monthly and seasonal temperature change. In general, the checkerboard plots display subtle differences in the degree of monthly warming across the GYA and HUCs.

Photo credit: Andrey Grinkevich/Upsplash.
Temperature Extremes in HUC6 Towns
The projected number of hot days (high temperature above 90°F [32°C]) and cold days (low temperature below 32°F [0°C]) per year change substantially over the 21st century for towns in the GYA (Figure 5-7). The trends in cold and hot days are statistically significant under both RCP4.5 and RCP8.5. While the number of days above 90°F (32°C) will increase in the GYA, neither nighttime temperatures (i.e., over 65°F [18°C]) nor heat indexes (a measure that combines temperature and relative humidity, commonly referred to as the “feels like” temperature) are projected to be exceptionally high. The differences in hot and cold hot days between the base period and future periods are summarized in Tables 5-2 and 5-3, respectively.

Figure 5-7. Time-series plots of the number of days per year with daily high temperatures above than 90°F (32°C; top) and daily low temperatures below 32°F (0°C; bottom) for selected towns in the Greater Yellowstone Area (GYA). The solid lines are the medians of the 20 models in the MACAv2-METDATA 1950-2005 (black line), and 2006-2099 under Representative Concentration Pathway 4.5 (RCP4.5, blue line) and RCP8.5 (red line). The shaded bands around the lines are the 10th (lower) and 90th (upper) percentiles of the models. The first inset number is the trend (in days/decade) for RCP4.5 (red) and the second number is the trend for RCP8.5 (blue). An asterisk indicates the trend is statistically significant at a 95% confidence level. The small triangles indicate the observed average at National Weather Service sites in the cities for the period of observations (which varies by location). The plotted data are from the MACAv2 METDATA grid cell containing or closest to the location of the city. The observed data are from National Weather Service records (Western Regional Climate Center undated).

The controls of wildfire include energy from the sun, the temperature and humidity of the air, precipitation, wind, and moisture levels of live and dead vegetation and a source of ignition, either from lightning or humans. These factors interact over timescales ranging from minutes to years and longer. Here we discuss some future conditions in the GYA that relate to fire.
The top panel of maps in the Figure Wf-A shows the number of cold days (when the average minimum temperature is below 32°F [0°C]), as a measure of winter warming. Under RCP4.5, the GYA will have nearly 4 weeks fewer cold days by mid century (2041-2060) than the 1986-2005 base period of about 7 months. By the end of century (2080-2099), there will be 5-6 fewer weeks below freezing than the base period average. Under RCP8.5, the reduction in cold days is even more dramatic (5 weeks for mid century and 10 weeks for end of century).

Figure Wf-A. Top panel: The number of days/year with average minimum temperature below 32°F (0°C) for the 1986-2005 base period (left column) and the changes for future periods under Representative Concentration Pathway 4.5 (RCP4.5) and RCP8.5 in the Greater Yellowstone Area. Bottom panel: Vapor pressure deficit (VPD) for the 1986-2005 base period (left column) and the changes for future periods under Representative Concentration Pathway 4.5 (RCP4.5) and RCP8.5. Vapor pressure deficit is shown as the average for May through September (MJJAS), historically the main months for wildfire. The mapped data are the 20-model means of the MACAv2-METDATA data.
Fewer cold days in the future suggest that on average winter temperatures will not be cold enough to kill bark beetles and bud worms in GYA forests. Already, warmer temperatures are allowing mountain pine beetles to go through multiple reproductive cycles in a year while extending their range to high-elevation whitebark pine forests (Jewett et al. 2010; Shanahan et al. 2016; Shanahan 2019).
Vapor pressure deficit is derived by combining air temperature and relative humidity. It determines the drying capacity of the atmosphere and, as such, affects fuels drying, plant transpiration and plant growth, and more. In conifer forests, high vapor pressure deficits limit tree growth and increase their vulnerability to, and mortality from, drought (Allen et al. 2010; Williams et al. 2013). High vapor pressure deficit also increases the potential for large and severe fires (Seager et al. 2015; Williams et al. 2015; Abatzoglou and Williams 2016). Today, vapor pressure deficits in GYA are greater at lower elevations—where air temperatures are higher and humidity is lower—than at higher elevations (Figure Wf-A, bottom panel). This pattern is projected to be maintained in the future as deficits increase progressively through the century under both RCPs with greater increases at lower elevations.
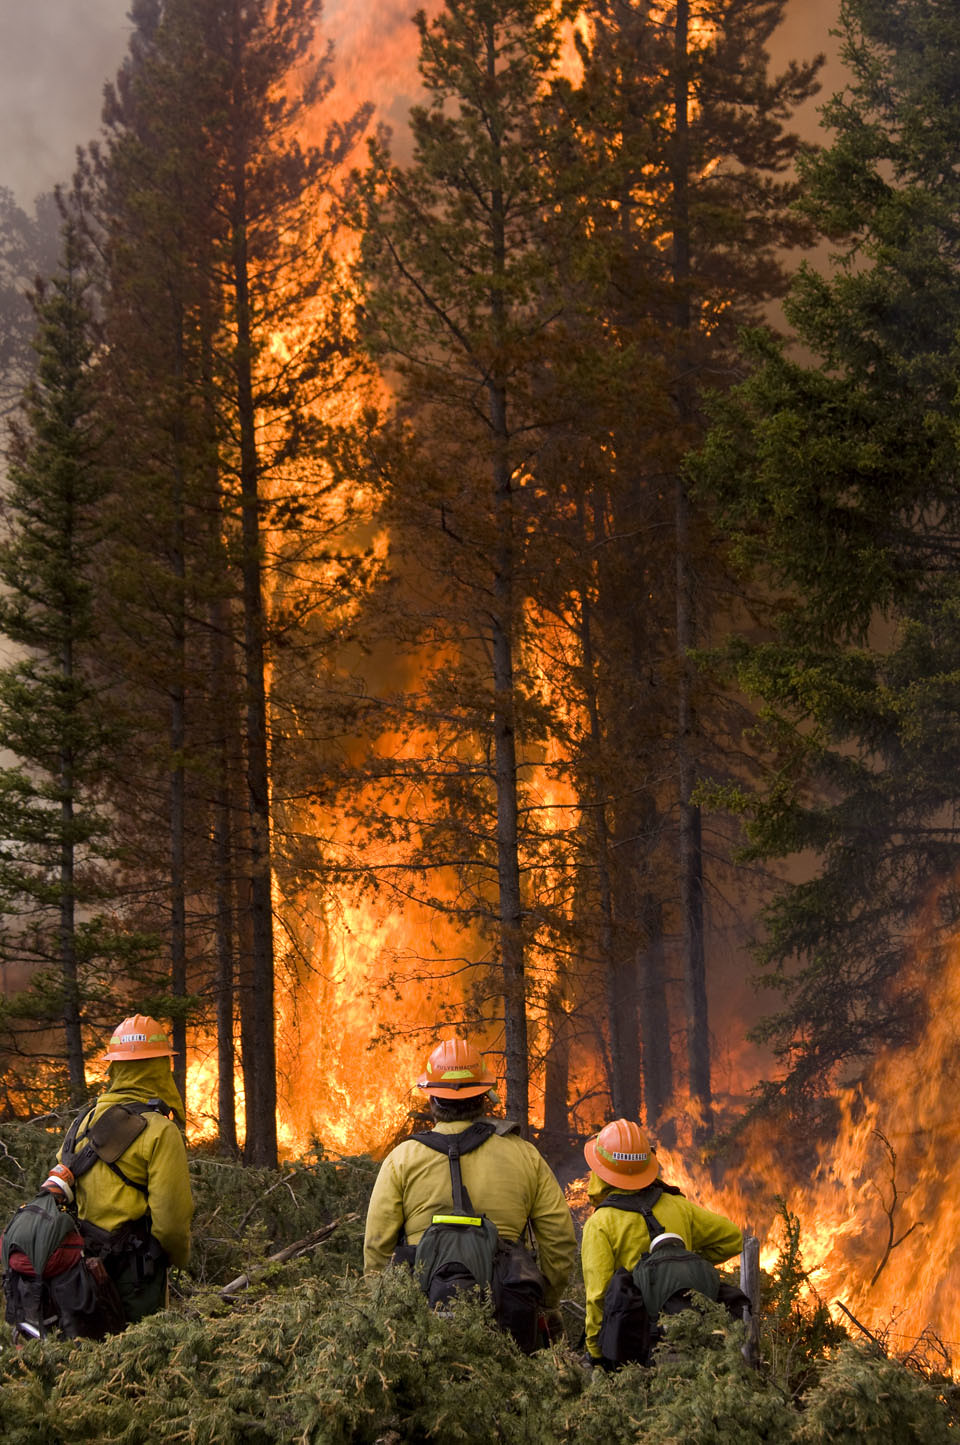
Wildfire. Photo courtesy of Greater Yellowstone Coalition.
In the future, earlier snowmelt and loss of snowpack as a result of warming winters, followed by warmer summers, longer growing seasons, and more limited soil moisture will increase fire potential at all elevations of the GYA (Westerling et al. 2006). This condition, combined with increased tree mortality, potentially will alter future fire regimes and lead to rapid changes in forest ecosystems (Westerling et al. 2011). Sustained changes in climate and fire disturbance will also affect post-fire recovery of species, thereby changing forest composition and converting forest to grassland at low elevations (Turner et al. 2019). Thus, increased fire activity portends large ecological changes and threatens human health and the communities living in fire-prone areas.
Projected rising temperatures will alter our demand for energy to heat houses and buildings in winter and cool them in summer. Two widely used temperature-based indicators of energy demand are annual heating degree days and cooling degree days.
Degree days are a measure of how much heating or cooling is needed when the daily average temperature is above or below a “comfortable” outside temperature of 65°F (18°C). For example, if the average daily temperature is 55°F (13°C), there are 10 heating degree days for that date. If the average daily temperature for the next day is 45°F (7.2°C), there are 20 heating degree days for that date and the 2-day total is 30. (If the daily average temperature is 65°F [18°C] or higher, there are zero heating degree days for that date as no energy is needed to heat the home or building.) Cooling degree days are determined similarly when the daily average temperature is above 65°F (18°C) and energy is needed to cool a home or building.
Annual heating or cooling degree days are the total of all daily values throughout the year. Information about future trends in heating and cooling degree days helps the building industry, energy companies, system operators, homeowners, and utilities plan to accommodate the effects of climate change.
Due to its high elevation and northerly location, for the 1986-2005 base period the average number of heating degree days over GYA (10,030) is above the national average (4395), and the annual number of cooling degree days (54) is far below the national average (1216) (NOAA-NCEI undated).
Future warming in winter will decrease the annual heating degree days in GYA (Figure En-A), which will lessen energy demand for commercial and home heating. Relative to the 1986-2005 base period, under RCP4.5 heating degree days decrease by 13% (from 10,030 to 8744) by mid century (2041-2060), and the decrease is 14% (8627) by the end of century (2080-2099). Under RCP8.5, the decreases are 16% (8378) and 31% (6881), respectively, for the two periods.
The percent change in the annual number of heating degree day across GYA cities, which are on average at lower elevations of the GYA, is relatively uniform. (Table En-A, Figure En-B, ), with an average decrease of 14% at mid century (2041-2060) and 19% at the end of century (2080-2099). Under RCP8.5, the average mid-century decrease is 19% and the end of century average decrease is 33%.
Projected summer warming will increase cooling degree days and the need for cooling systems in the GYA, but to a lesser extent than other parts of the country. Mid century (2041-2060) cooling degree days increase by 91% (to 103, presently at 54) and by the end of century they increase by 191% (157, presently 54) in RCP4.5. Under RCP8.5, by mid century cooling degree days increase by 196% (to 160) and by 844% (510) at the end of century. The need for new or additional cooling largely occurs in lower elevations.

Photo credit: Alireza Kaviani/Pexels.
Over the 1986-2005 base period, the annual number of cooling degree days differs substantially across GYA cities (Figure En-C). Under RCP4.5 mid century (2041-2060) annual increases range from 80% (345) at Cody WY to 537% (80) at Pinedale WY (Figure En-C, Table En-B), and by the end of century (2080-2099) cooling degree days increase from 113% (488) at Cody to 867% (130) at Pinedale. (Note that some percentage changes are very large in comparison to heating degree days because they reflect relatively large changes in small numbers, e.g., from 15 at present to 130 by the end of century at Pinedale.) Under RCP8.5 changes in cooling degree days are more extreme and range from 110% (477) at Cody to 805% (135) at Pinedale at mid century, and 267% (1154) at Cody and 3351% (501) at Pinedale at the end of century.
According to the National Academies of Science, space heating consumes more than twice as much energy as cooling nationally (NAS undated). So, the good news is that by mid century, under both RCPs the projected decrease in heating degree days in the towns is roughly five times greater than the increase in cooling degree days, which would mean less annual energy use in the future.

Figure En-A. Annual number of heating degree days (top two rows) and cooling degree days (bottom two rows) in the Greater Yellowstone Area. The 1986-2005 base periods are shown in the left column and changes for the four future periods are shown to the right. The mapped data are the 20-model means computed from MACAv2-METDATA daily average minimum temperature (heating degree days) and daily average maximum temperature (cooling degree days).
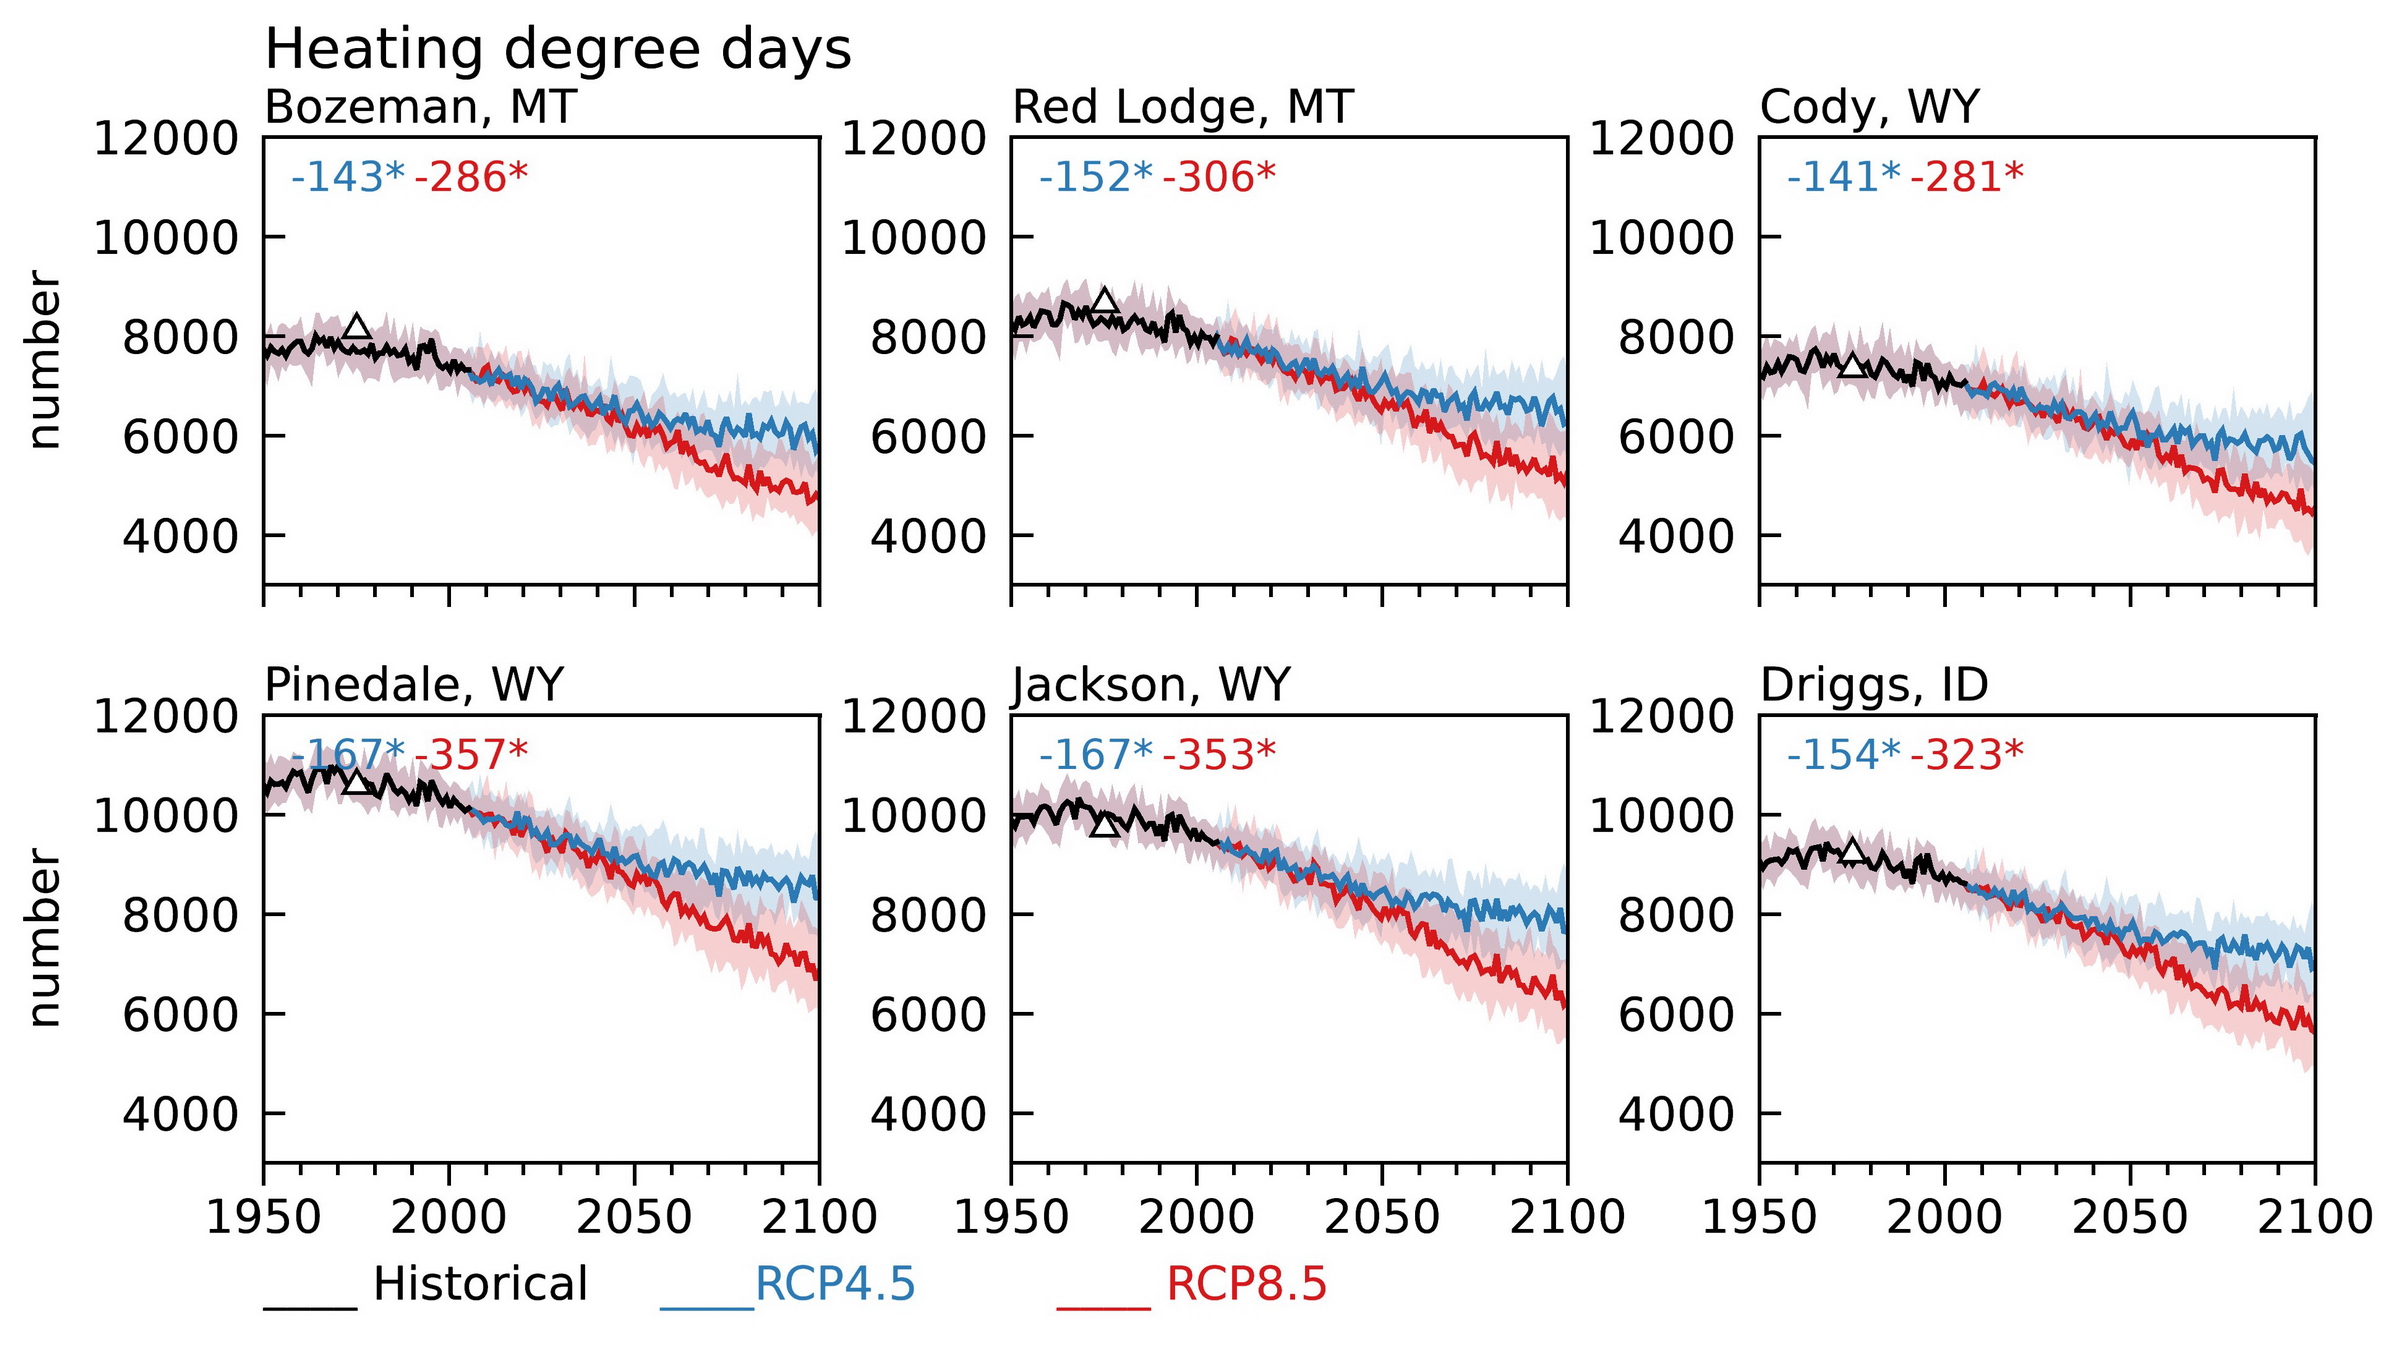
Figure En-B. Total annual heating degree days for selected towns in the Greater Yellowstone Area. The solid lines are the medians of the 20 models in the MACAv2-METDATA 1950-2005 (black line), and 2006-2099 under Representative Concentration Pathway 4.5 (RCP4.5, blue line) and RCP8.5 (red line). The shaded bands around the lines are the 10th (lower) and 90th (upper) percentiles of the models The first number in the inset parentheses is the trend (in number/decade) for RCP4.5 and the second number is the trend for RCP8.5. An asterisk indicates a trend that is statistically significant at a 95% confidence level. The black triangles indicate the observed average at National Weather Service sites in the cities (Western Regional Climate Center undated).

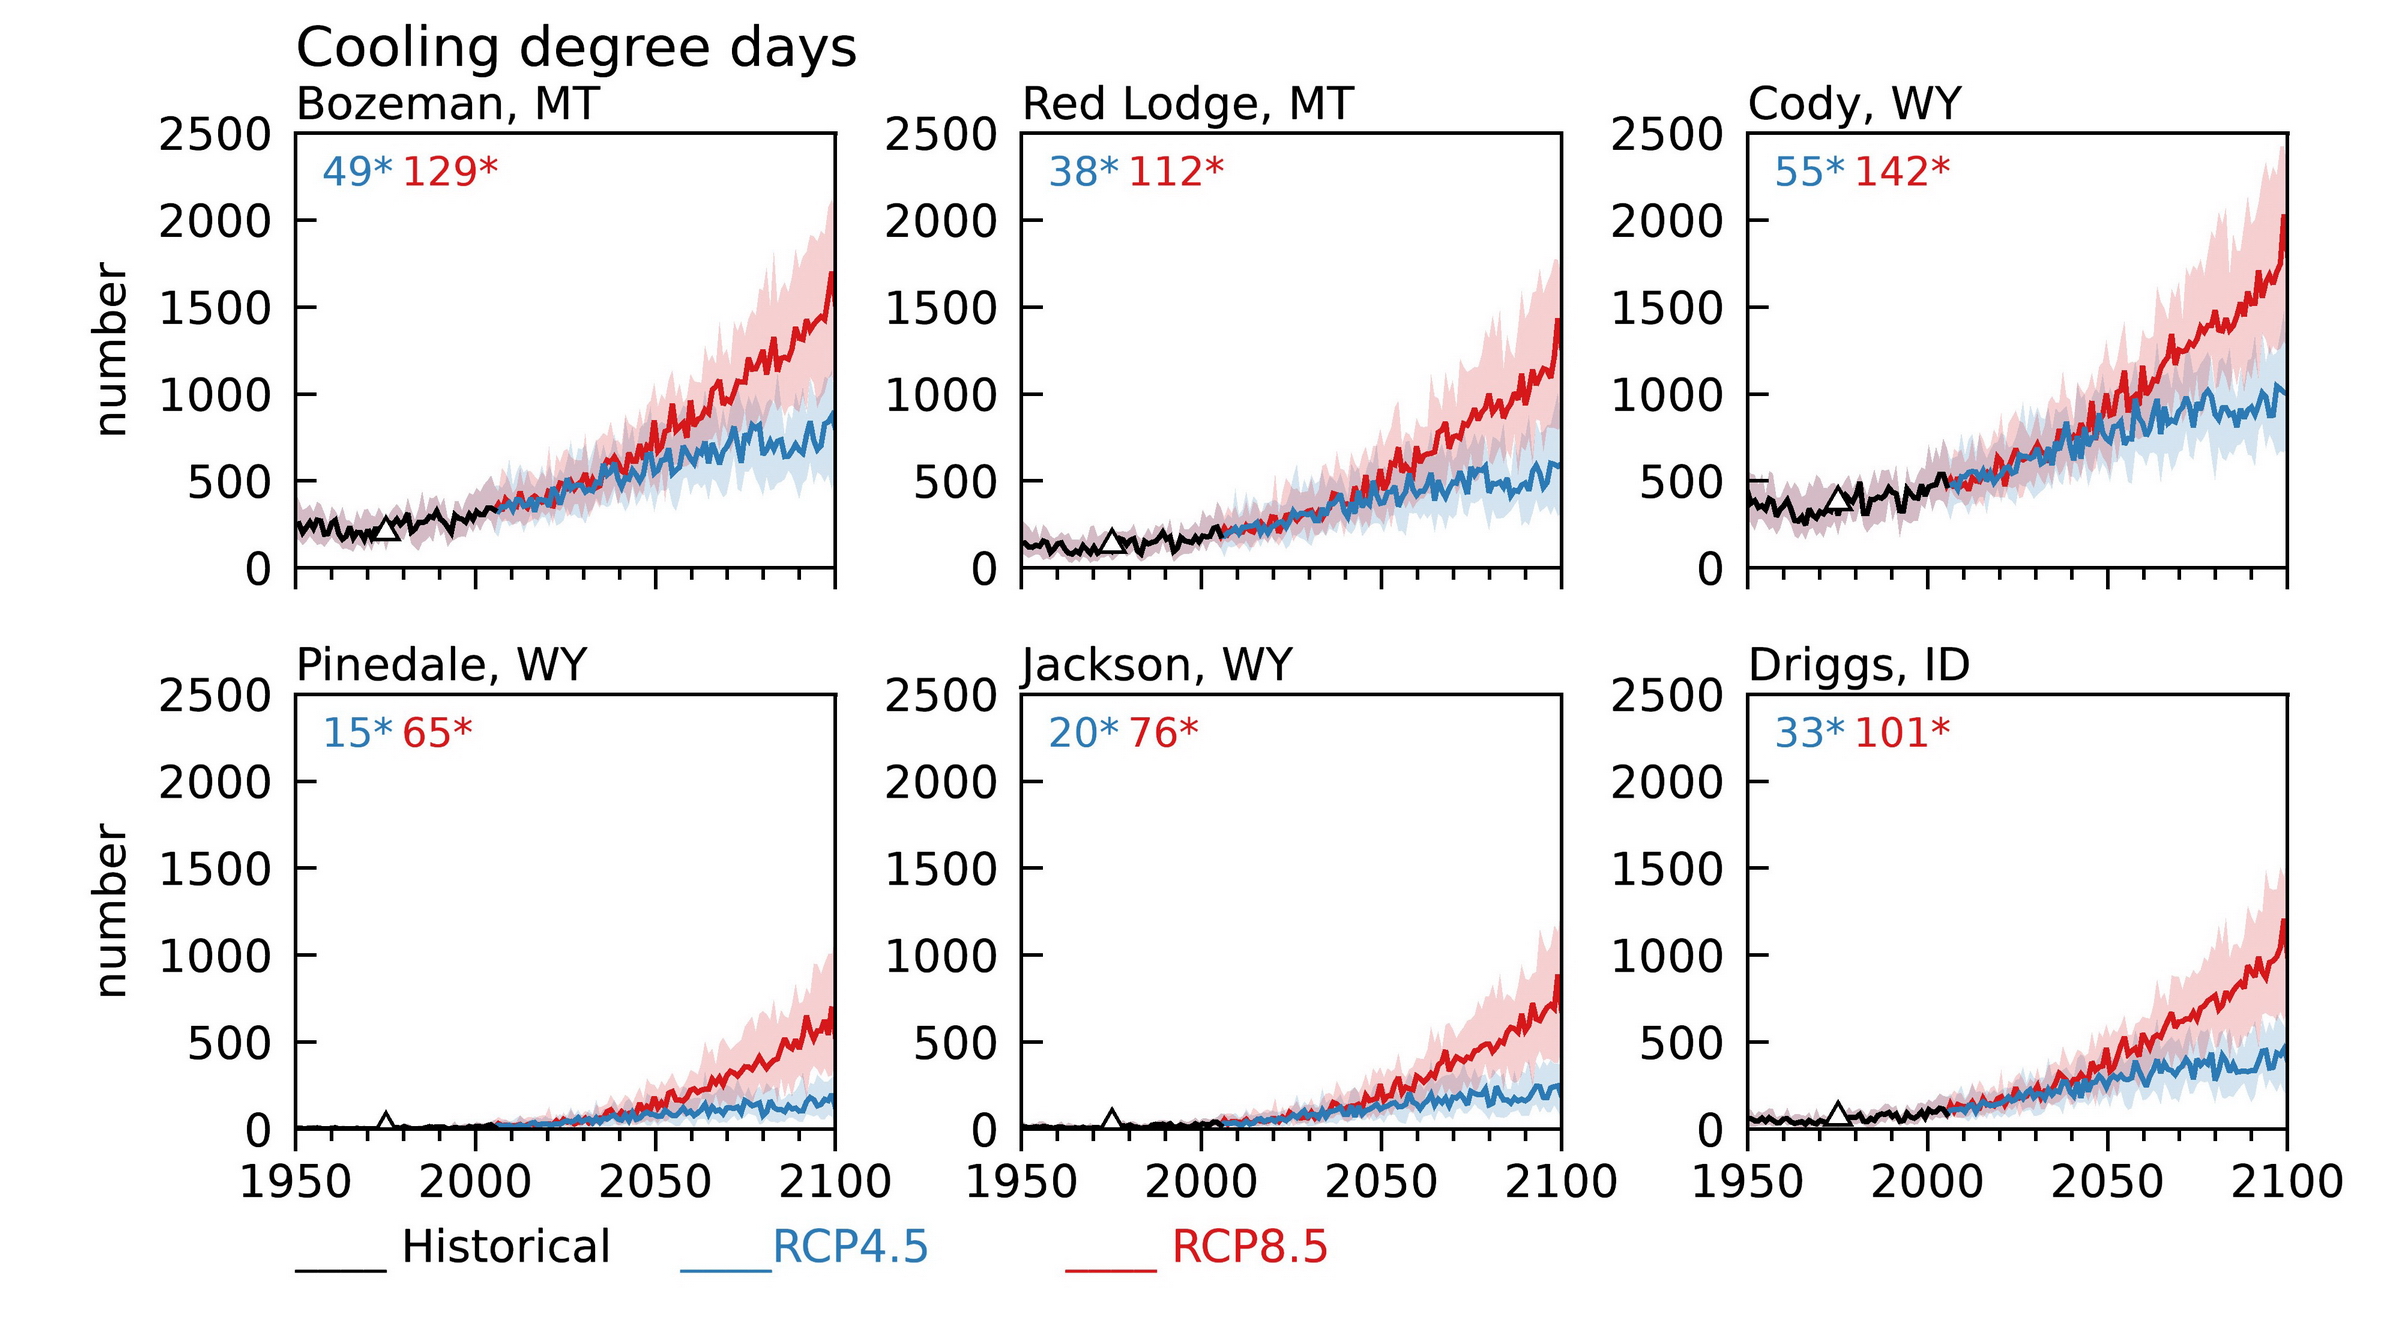
Figure En-C. Total annual cooling degree days for selected towns in the Greater Yellowstone Area. The solid lines are the medians of the 20 models in the MACAv2-METDATA 1950-2005 (black line), and 2006-2099 under Representative Concentration Pathway 4.5 (RCP4.5, blue line) and RCP8.5 (red line). The shaded bands around the lines are the 10th (lower) and 90th (upper) percentiles of the models The first number in the inset parentheses is the trend (in number/decade) for RCP4.5 and the second number is the trend for RCP8.5. An asterisk indicates a trend that is statistically significant at a 95% confidence level. The black triangles indicate the observed average at National Weather Service sites in the cities (Western Regional Climate Center undated).

Many aspects of climate affect agriculture, including length of growing season, timing and availability of water, and extreme events such as heat waves, cold snaps, floods, and droughts. Here we examine projected changes in the growing season in the GYA.
The growing season in the GYA today is up to 2 weeks longer than it was in the 1950s, and projections indicate that the growing season in the GYA will be longer and warmer in the future. Under both RCP4.5 and RCP8.5, growing seasons in the future start earlier and end later in the year (Figure Ag-A). The season is lengthened more at low elevations than at high elevations. Under RCP4.5, at mid century (2041-2060) the average growing season length increases by about 3 weeks from the 1986-2005 base-period average of 23 weeks, and by 5 weeks at the end of century (2080-2099). Under RCP8.5, the increases are over 5 weeks and 9 weeks, respectively, for the two periods.

Figure Ag-A. Growing season length in the Greater Yellowstone Area based on temperatures greater than 45°F (7.2°C) (the germination temperature for wheat) for the 1986-2005 base period (left column) and changes over the 21st century under Representative Concentration Pathway 4.5 (RCP4.5, top row) and RCP8.5 (bottom row). The mapped data are 20-model means computed from MACAv2-METDATA daily average temperature.
At representative towns across the GYA, under RCP4.5 (2041-2060) growing season length increases mid century by 3-4 weeks (Figure Ag-B, Table Ag-A), and by 4-6 weeks at the end of century (2080-2099). The growing season lengthens even more under RCP8.5, reaching 4-5 weeks at mid century and 7-11 weeks by the end of century.

Cattle grazing. Photo courtesy of Rob Van Kirk.
Recent climate assessments for the Northern Great Plains (Conant et al. 2018) and Montana (Whitlock et al. 2017) suggest the likelihood of both positive and negative impacts on regional agriculture in the future, but the high elevation and diverse topography of the GYA may be somewhat buffered from the negative impacts that are projected in the Great Plains. For example, the greenhouse effect of elevated CO2 levels may offer the opportunity to grow new plant varieties, and the likelihood of earlier green-up means an earlier grazing season. Still, while some crops and livestock may benefit from longer, warmer growing seasons in the GYA, irrigated and non-irrigated production will need to accommodate earlier snowmelt and timing of runoff, and reduced late-season soil moisture (discussed in Chapter 7). Warmer conditions may also decrease forage quality and support an increase in crop pests (Conant et al. 2018).

Figure Ag-B. Growing season length (base 45°F [7.2°C], the germination temperature of wheat) for selected towns in the Greater Yellowstone Area. The solid lines are the medians of the 20 models in the MACAv2-METDATA 1950-2005 (black line), and 2006-2099 under Representative Concentration Pathway 4.5 (RCP4.5, blue line) and RCP8.5 (red line). The shaded bands around the lines are the 10th (lower) and 90th (upper) percentiles of the models. The first inset number is the trend (in days/decade) for RCP4.5 (blue) and the second number is the trend for RCP8.5 (red). An asterisk indicates a trend that is statistically significant at a 95% confidence level. Computed from the MACAv2 METDATA daily mean temperature.

Summary of Projected Temperature Changes
-
Under both RCP4.5 and RCP8.5, there is 100% model agreement and SNRs >1 in the projected change in mean annual, seasonal, and monthly minimum, maximum, and mean temperatures relative to the 1986-2005 base period in the GYA and the HUC6 watersheds, consistent with previous studies (Whitlock et al. 2017).
-
Projected annual warming trends in the HUC6 watersheds are 0.5°F (0.3°C)/decade under RCP4.5 and 1.1-1.2°F (0.6-0.7°C)/decade under RCP8.5. The trends are statistically significant at a 95% confidence level over all HUC6 watersheds.
-
Under both RCP4.5 and RCP8.5, warm spells in the GYA increase through the 21st century (Figure 5-3). Under RCP8.5, by the end of the century the warm spell duration index is greater than 200 days out of the year. The steady increase in the warm spell duration index represents a fundamental warming of the daily maximum temperature, as opposed to heatwaves, which are extremes relative to the prevailing climatology.
-
The modeled mean annual number of cold days (below 32°F [0°C]) and hot days (above 90°F [32°C]) at selected towns in the GYA agree with the 1950-2005 mean of observations, and the projected trends in the number of cold and hot days are statistically significant under both RCP4.5 and RCP8.5, also consistent with previous studies (Whitlock et al. 2017; Conant et al. 2018).
-
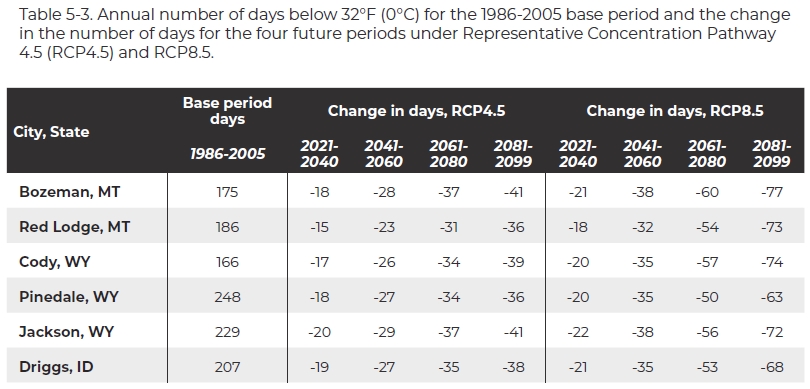
In the HUC6 watersheds, under RCP4.5 mid century (2041-2060) decreases in the number of cold days/yr range from 23 at Red Lodge MT (base period mean 186), to 28 at Bozeman MT (base period mean 175), and 29 at Jackson WY (base period mean 229). By the end of century (2080-2099) decreases range from 36 at Red Lodge and Pinedale WY to 41 days at Bozeman and Jackson. Under RCP8.5 decreases range from 32 days at Red Lodge to 38 days at Jackson and Bozeman by mid century, and from 63 days at Pinedale to 77 days at Bozeman by the end of century.
-
In the HUC6 watersheds, under RCP4.5 mid century (2041-2060) increases in hot days/yr range from 5 at Pinedale WY (base period mean 0) and Jackson WY (base period mean 0), to 23 at Bozeman MT (base period mean 9) and Cody WY (base period mean 11). By the end of century (2080-2099) increases in hot days/yr range from 9 at Pinedale and 10 at Jackson, to 31 in Bozeman and 32 in Cody. Under RCP8.5 increases in hot days/yr range from 10 in Pinedale and Jackson to 32 at Cody by mid century, and from 42 at Pinedale and Jackson to 64 at Cody at the end of century.
-
Under RCP4.5, at mid century (2041-2060) the average growing season length increases by about 3 weeks from the 1986-2005 base-period average of 23 weeks, and by 5 weeks at the end of century (2080-2099). Under RCP8.5, the increases are over 5 weeks and 9 weeks, respectively, for the two periods.
-
Projected warmer cold season temperatures will reduce energy demands for heating and warmer summers will increase energy demands for cooling. The energy reduction for heating could be as much as five times greater than the increase for cooling.
-
In the future, earlier snowmelt, and loss of snowpack during warmer winters followed by warmer summers and longer growing seasons will increase fire potential at all elevations of GYA. Increased fire activity portends large ecological changes and threatens human health and the communities living in fire-prone areas.
Chapter 5 Appendix—A Deeper Look
Climate variables
Figures supporting Chapter 5
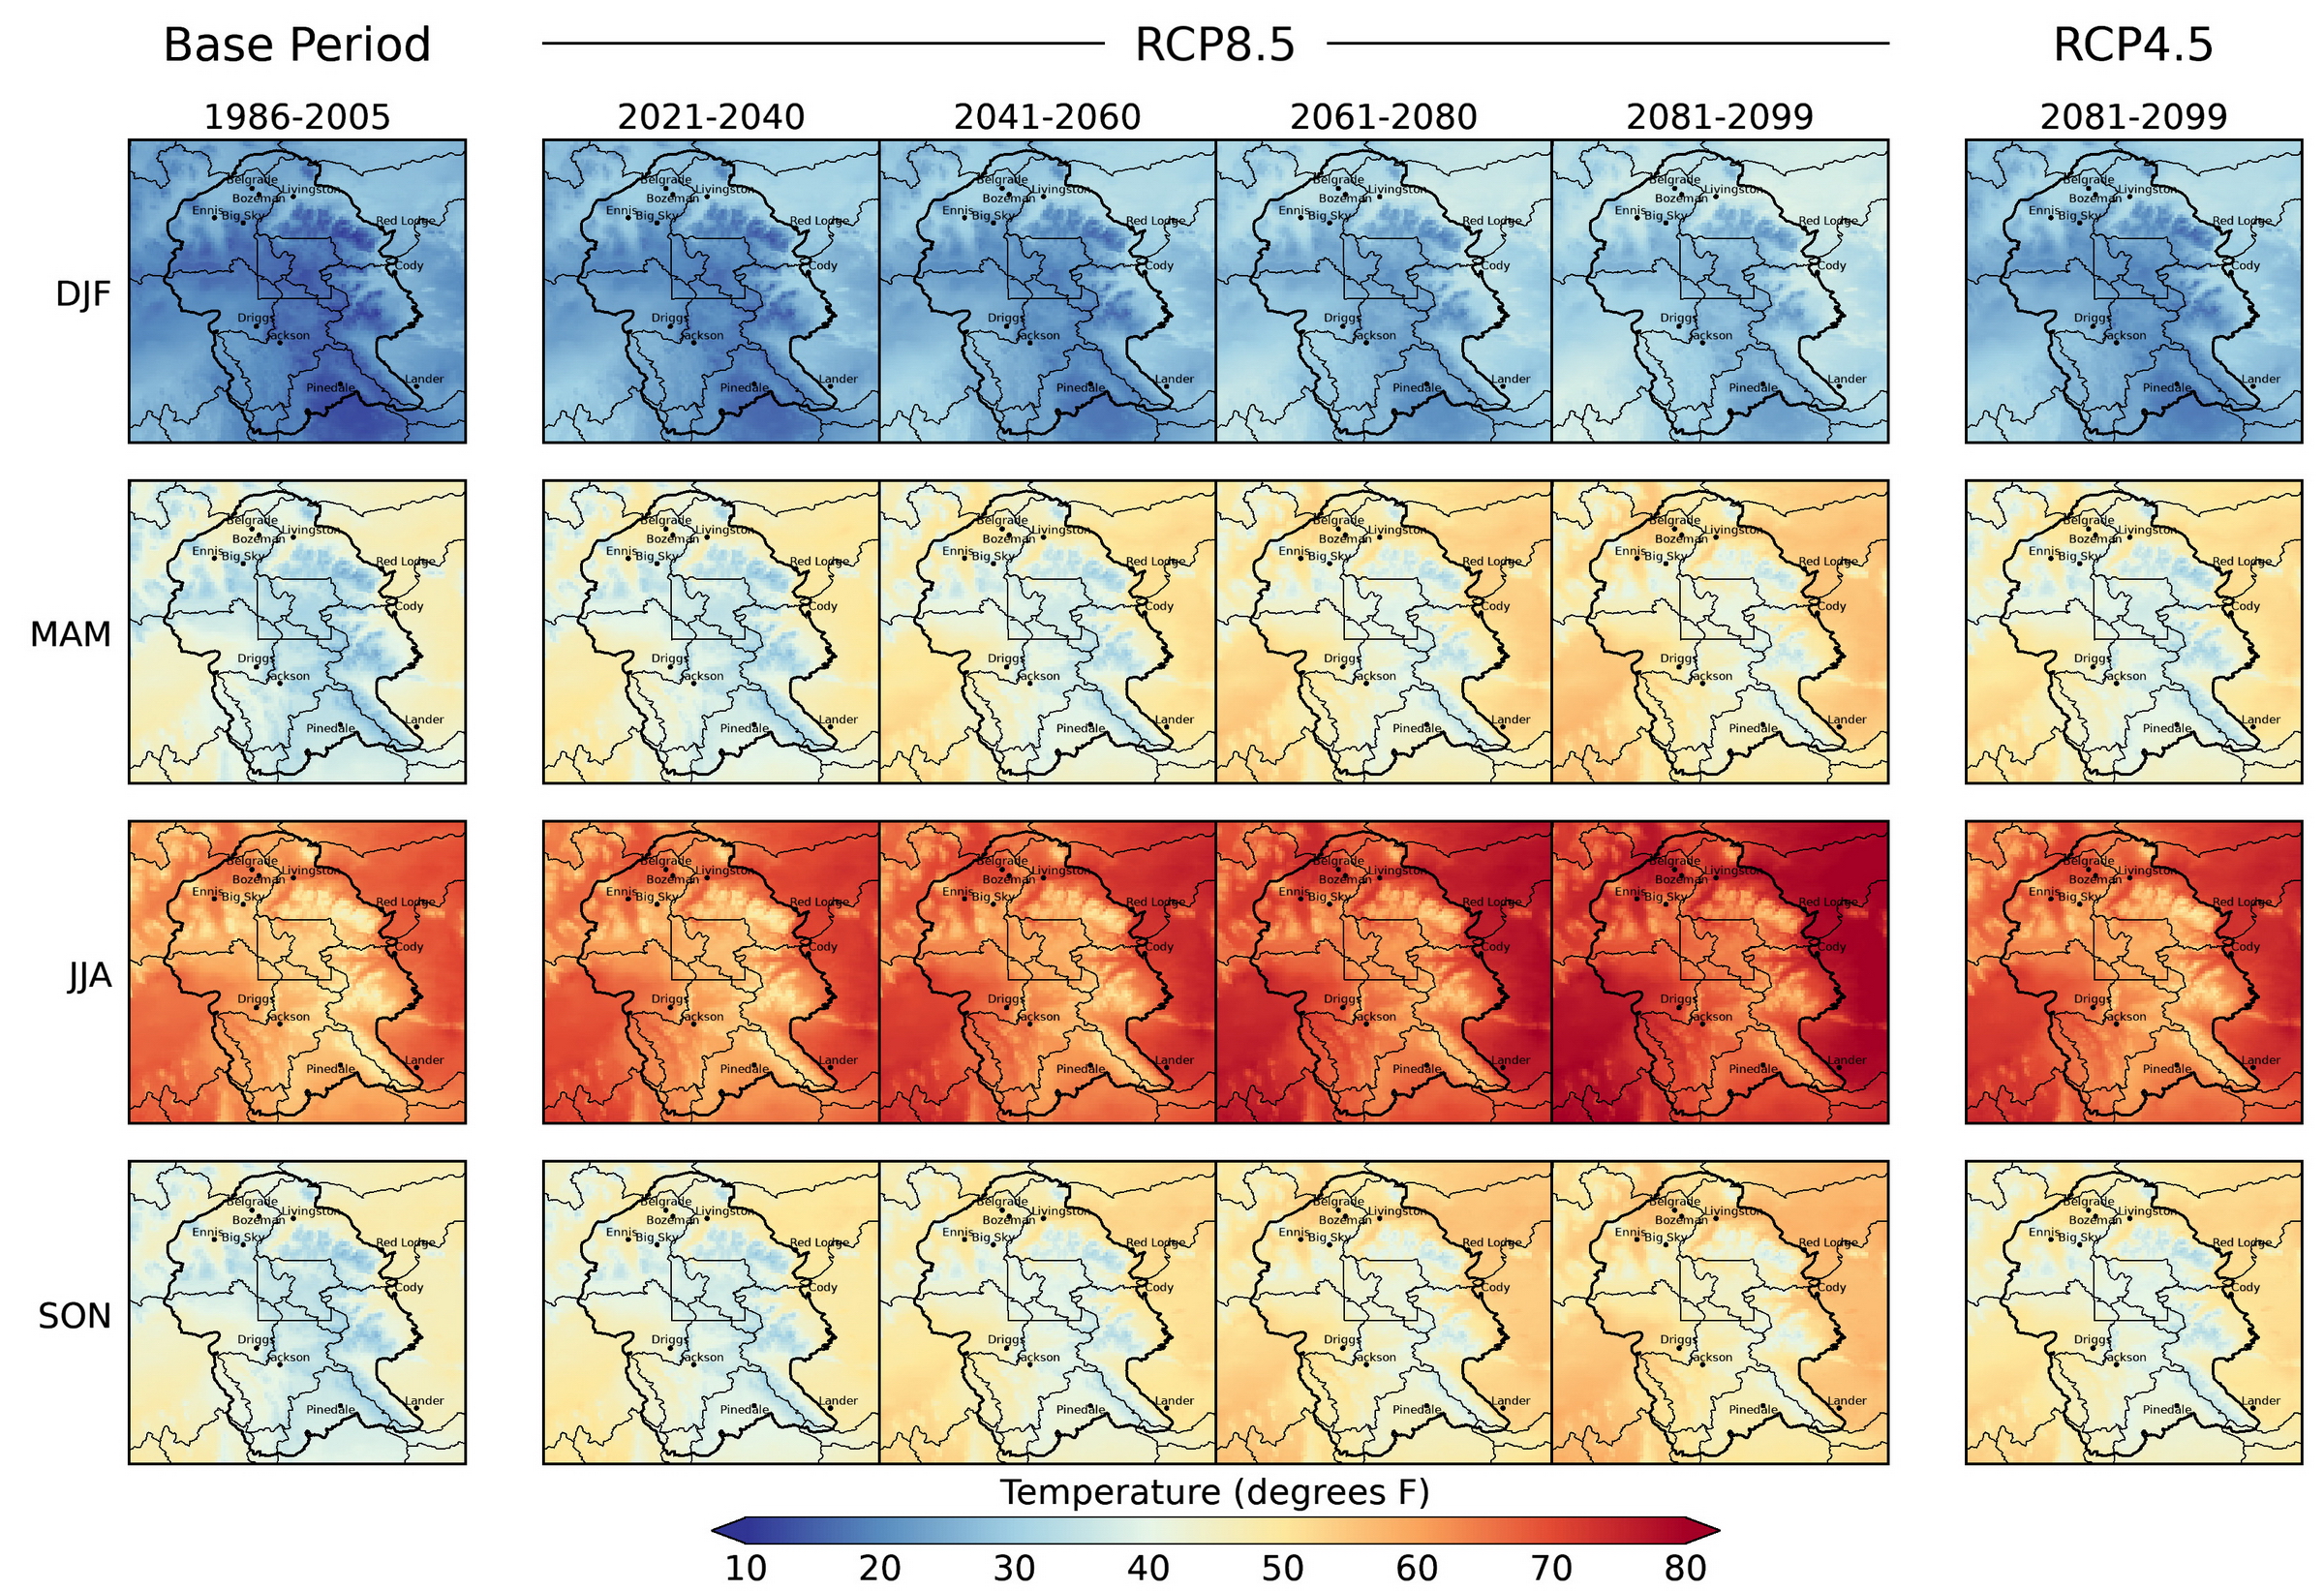
Figure A5-1. Seasonal mean temperature (average of minimum and maximum temperatures) in the Greater Yellowstone Area for the 1986-2005 base period (left column), Representative Concentration Pathway 8.5 (RCP8.5, four center columns), and the end of the 21st century under RCP4.5 (right column). The seasons (e.g., December-February [DJF]) are arranged in rows and the future periods (e.g., 2021-2040) are in columns. The mapped data are the 20-model means of the MACAv2-METDATA.
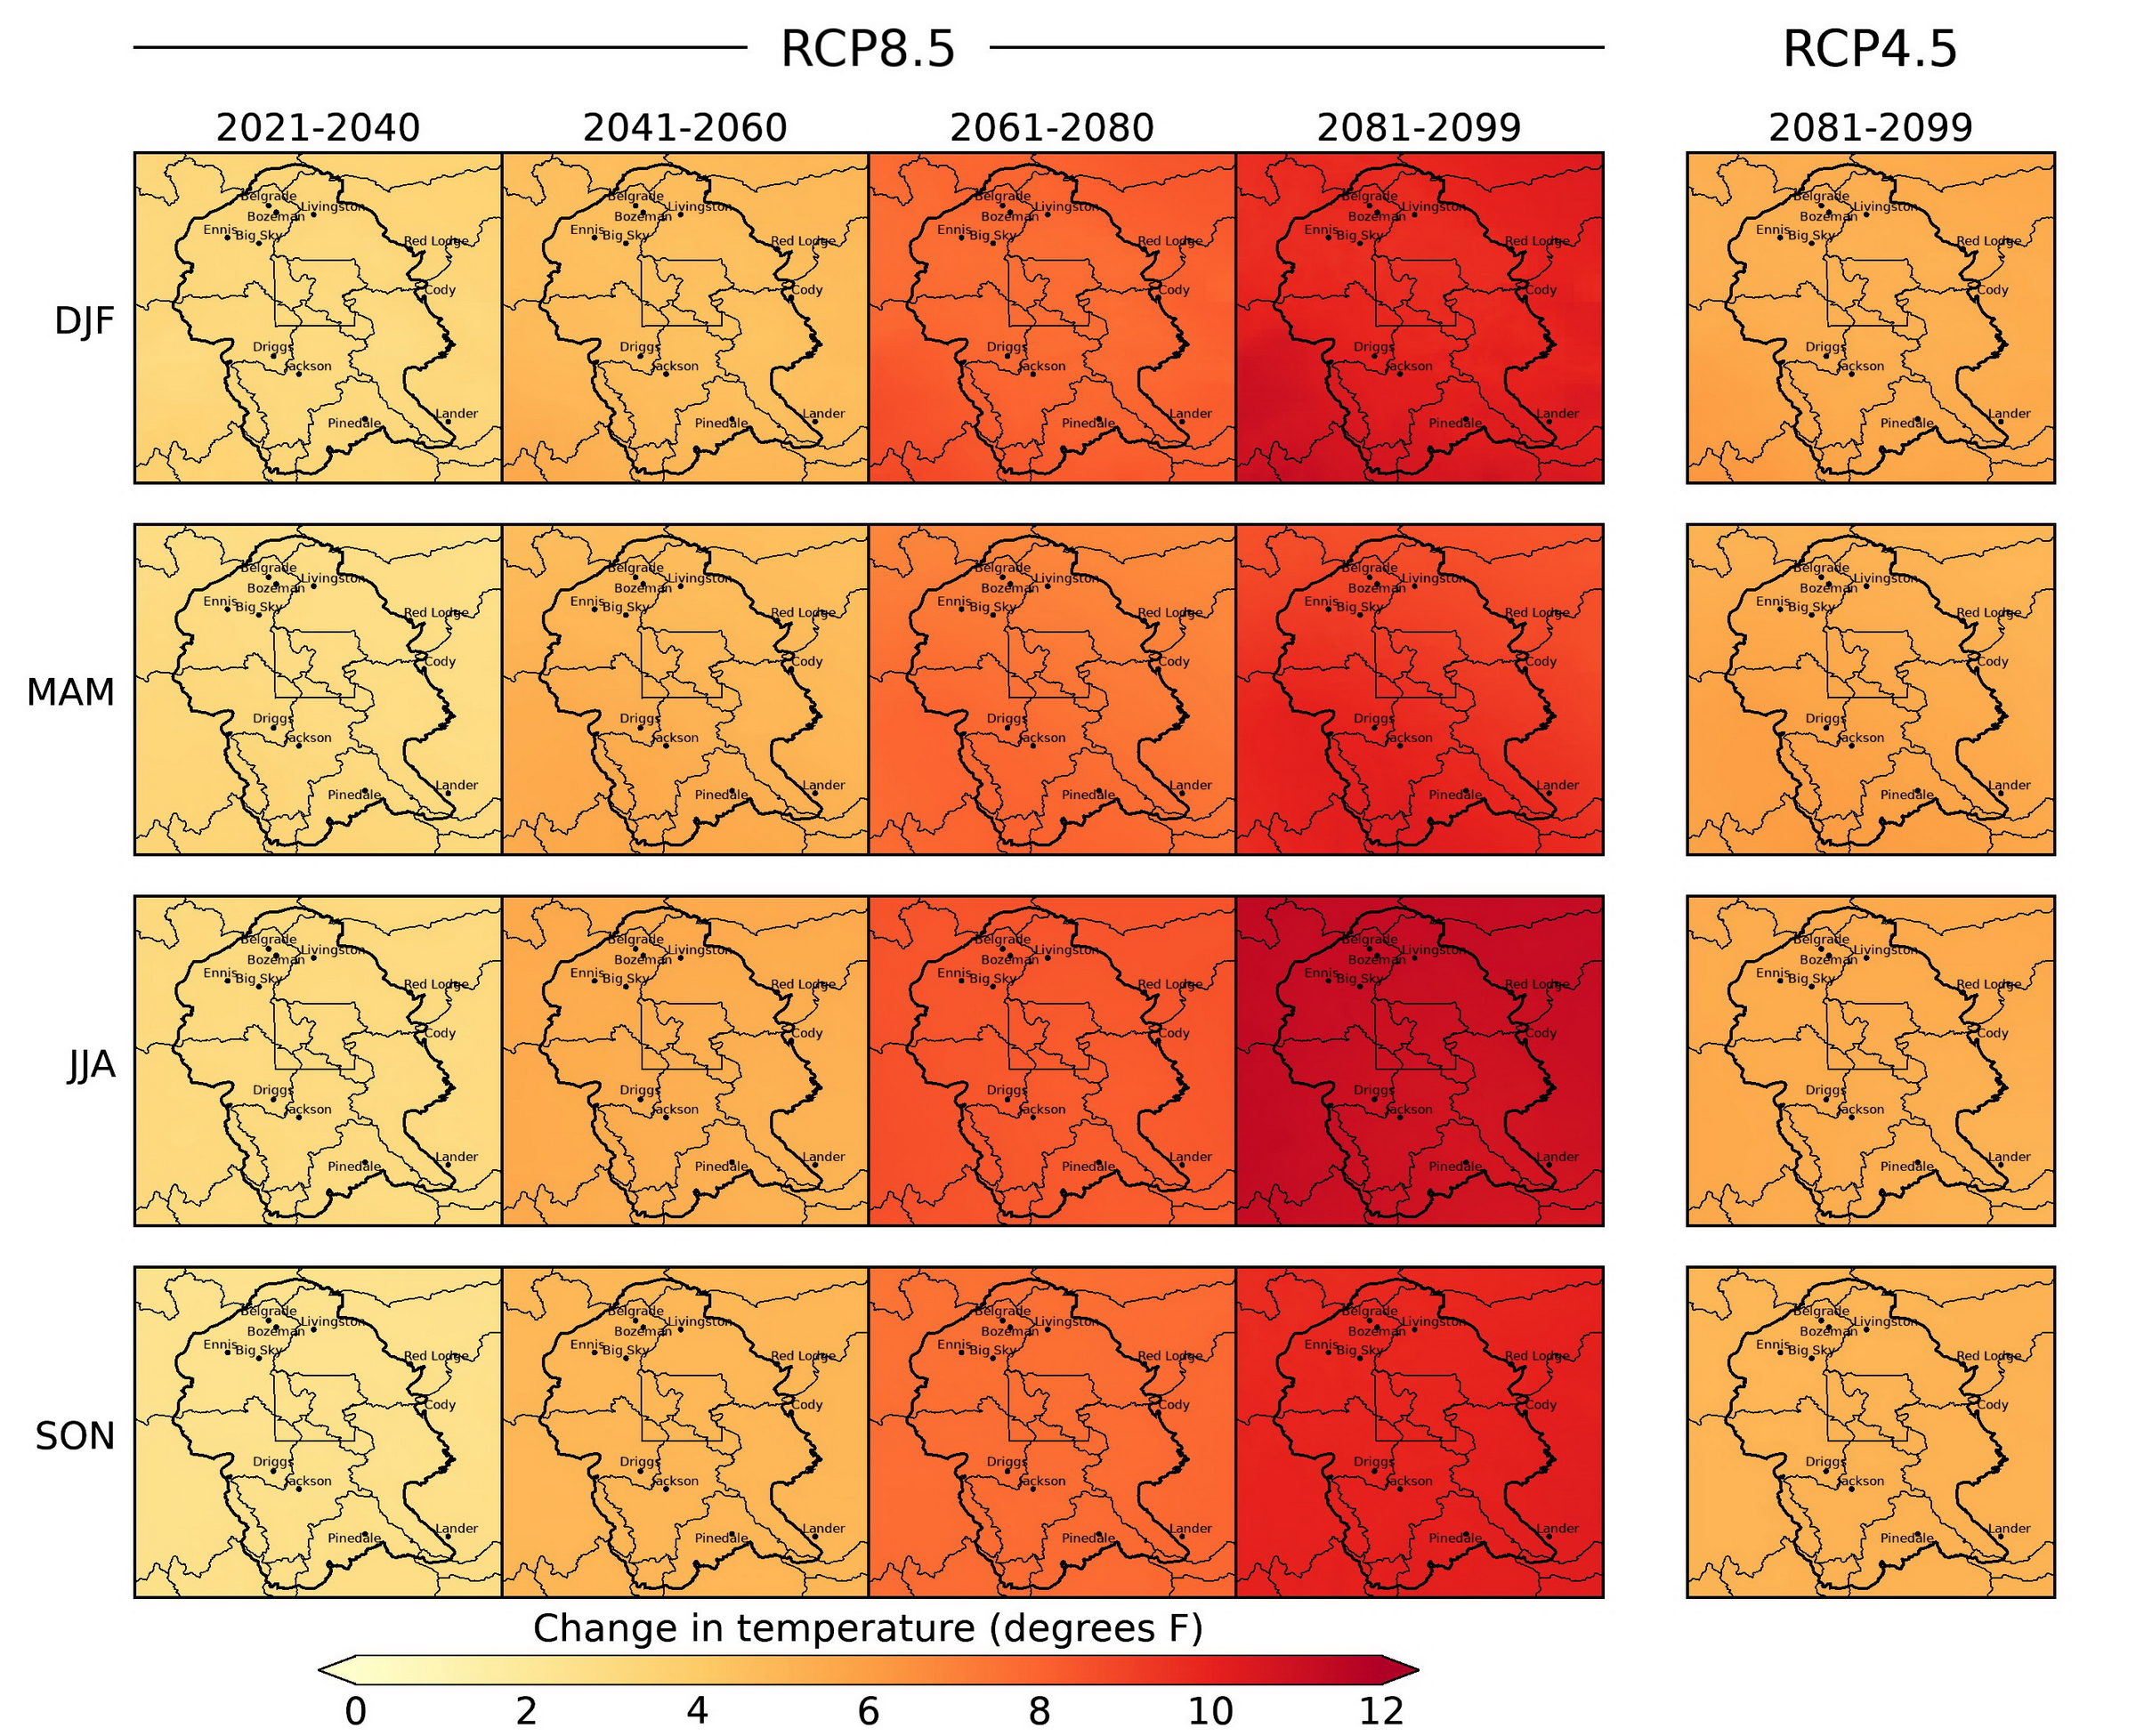
Figure A5-2. Change in seasonal mean temperature (average of minimum and maximum temperatures) in the Greater Yellowstone Area under Representative Concentration Pathway 8.5 (RCP8.5, left four columns) and at the end of the 21st century under RCP4.5 (right column). The seasons (e.g., December-February [DJF]) are arranged in rows and the changes relative to the 1986-2005 base period for each future period (e.g., 2021-2040) are in columns. The mapped data are the 20-model means of the MACAv2-METDATA.

Figure A5.3. The range of projected change in seasonal mean of maximum air temperature under Representative Concentration Pathway 8.5 (RCP8.5) for the Hydrologic Unit Code 6 (HUC6) watersheds, as simulated individually by the 20 downscaled global climate models (GCMs) in the MACAv2-METDATA. The seasons are in columns and the future period are in rows. Within each block the GCM names and their mean (Mean Model) are labeled on the left and the HUC6 watersheds are labeled at the bottom. See Table A4-1 for model details.
Literature Cited
Abatzoglou JT, Williams AP. 2016. Impact of anthropogenic climate change on wildfire across western US forests. Proceedings of the National Academy of Sciences 113:11770-5.
Allen CD, Macalady AK, Chenchouni H, Bachelet D, McDowell N, Vennetier M, Kitzberger T, Rigling A, Breshears DD, Hogg EH, Gonzalez P, Fensham R, Zhang Z, Castro J, Demidova N, Lim J-H, Allard G, Running SW, Semerci A, Cobb N. 2010. A global overview of drought and heat-induced tree mortality reveals emerging climate change risks for forests. Forest Ecology and Management 259(4):660-84. https://doi.org/10.1016/j.foreco.2009.09.001.
Conant RT, Kluck D, Anderson M, Badger A, Boustead BM, Derner J, Farris L, Hayes M, Livneh B, McNeeley S, Peck D, Shulski M, Small V. 2018. Northern Great Plains [chapter 22]. In: Impacts, Risks, and Adaptation in the United States: Fourth National Climate Assessment, vol II. In: Reidmiller DR, Avery CW, Easterling DR, Kunkel KE, Lewis KLM, Maycock TK, Stewart BC, editors. Washington DC: US Global Change Research Program. p 941-86. https://doi.org/10.7930/NCA4.2018.CH22.
[IPCC] Intergovernmental Panel on Climate Change. 2014. Climate Change 2014: synthesis report: contribution of working groups I, II and III to the Fifth Assessment Report of the Intergovernmental Panel on Climate Change. Pachauri RK, Meyer LA, eds. Geneva Switzerland: Intergovernmental Panel on Climate Change. 151 p.
Jewett JT, Lawrence RL, Marshall LA, Gessler PE, Powell SL, Savage SL. 2011. Spatiotemporal relationships between climate and whitebark pine mortality in the Greater Yellowstone Ecosystem. Forest Science 57(4): 320-35. https://doi.org/10.1093/forestscience/57.4.320.
[NAS] National Academy of Sciences, Engineering, Medicine. [undated][. What you need to know about energy: energy efficiency [webpage]. Available online http://needtoknow.nas.edu/energy/energy-efficiency/heating-cooling/. Accessed Feb 2021.
[NOAA-NCEI] National Oceanic and Atmospheric Administration-National Centers for Environmental Information. [undated]. Comparative climatic data [webpage]. Available online https://www.ncdc.noaa.gov/ghcn/comparative-climatic-data. Accessed 13 May 2021.
Seager R, Hooks A, Williams AP, Cook B, Nakamura J, Henderson N. 2015 (Jun). Climatology, variability, and trends in the US vapor pressure deficit, an important fire-related meteorological quantity. Journal of Applied Meteorology and Climatology 54:1121-41. https://doi.org/10.1175/JAMC-D-14-0321.1.
Shanahan E. 2019. An uncertain future: the persistence of whitebark pine in the Greater Yellowstone Ecosystem. Yellowstone Science 27(1):67-71.
Shanahan E, Irvine KM, Thoma D, Wilmoth S, Ray A, Legg K, Shovic H. 2016 (Dec). Whitebark pine mortality related to white pine blister rust, mountain pine beetle outbreak, and water availability. Ecosphere 7(12):e01610. https://doi.org/10.1002/ecs2.1610.
Turner MG, Braziunas KH, Hansen WD, Harvey BJ. 2019. Short-interval severe fire erodes the resilience of subalpine lodgepole pine forests. Proceedings of the National Academy of Sciences 116:11319-28.
Westerling AL, Hidalgo HG, Cayan DR, Swetnam TW. 2006. Warming and earlier spring increase western US forest wildfire activity. Science 313:940-3.
Westerling AL, Turner MG, Smithwick EAH, Romme WH, Ryan MG. 2011. Continued warming could transform Greater Yellowstone fire regimes by mid-21st century. Proceedings of the National Academy of Sciences USA 108:13165-70. https://doi.org/10.1073/pnas.1110199108.
Western Regional Climate Center. [undated]. Local climate data summaries [webpage]. Available online https://wrcc.dri.edu/summary/lcd.html. Accessed Jan 2020.
Whitlock C, Cross W, Maxwell B, Silverman N, Wade AA. 2017. 2017 Montana Climate Assessment. Bozeman and Missoula MT: Montana State University and University of Montana, Montana Institute on Ecosystems. 318 p. doi:10.15788/m2ww8w.
Williams AP, Seager R, Macalady AK, Berkelhammer M, Crimmins MA, Swetnam TW, Trugman AT, Buenning N, Noone D, McDowell NG, Hryniw N, Mora CI, Rahn T. 2015. Correlations between components of the water balance and burned area reveal new insights for predicting forest fire area in the southwest United States. International Journal of Wildland Fire 24(1):14-26. https://doi.org/10.1071/WF14023.
Williams P, Allen CD, Macalady AK, Griffin D, Woodhouse CA, Meko DM, Swetnam TW, Rauscher SA, Seager R, Grissino-Mayer HD, Dean JS, Cook ER, Gangodagamage C, Cai M, McDowell NG. 2013. Temperature as a potent driver of regional forest drought stress and tree mortality. Nature Climate Change 3:292-7.
[1] RCP (Representative Concentration Pathway) projections are described in Chapter 4, including graphically in Figure 4-1.

Bridger Foothills Fire near Bozeman MT, September 2020. Photo courtesy of Janice Gaedtke.